


See more of our coverage on Google.
Add usatruckloadshipping.com as a preferred source!

The spot market is a real-time pricing environment where shippers book truckload capacity based on current supply, demand, and fuel costs. There are various indicators in the spot market that you can monitor to determine the type of prices you can expect. This guide is for shippers, brokers, and logistics professionals who need to learn spot market signals and improve tender acceptance.
The spot freight market tracks real-time truckload pricing across regions, equipment types, and fuel conditions.
The spot market reflects data like:
These factors influence spot rates, which are a carrier’s rate to ship loads on-the-spot based on current freight data. Let’s review each one and how they affect the spot market.
Truckload spot market indicators include the current rate to book semi-trailers, like:
Each mode varies in price regionally in the U.S. and fluctuates with seasonal trends that affect trucking capacity. Trucking capacity is the amount of semi-trailers, or trucks, available at any given time to meet customer demand.
We’ve made a chart with an example of how the spot market would display this data:
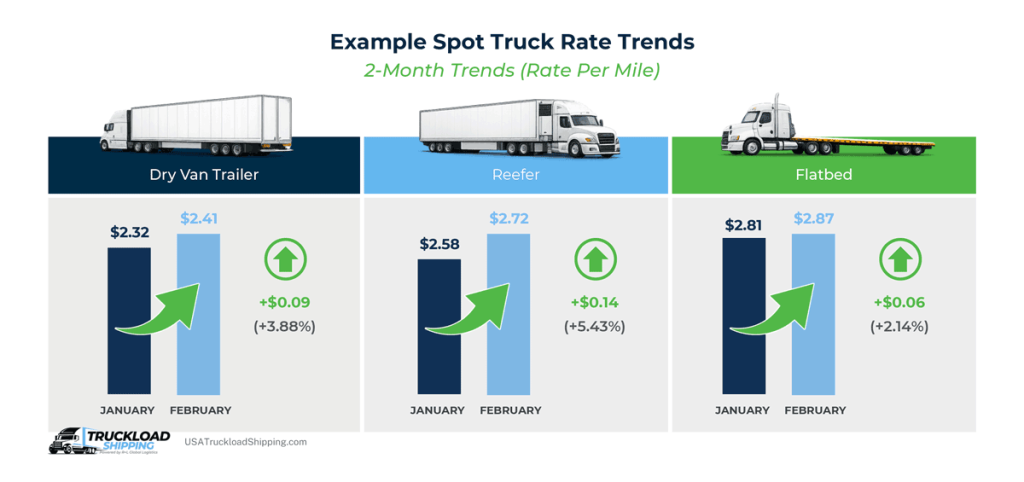
*2-month rate trend example based on DAT Trendlines’ National Spot Rates report for dry vans, flatbeds, and reefers from January to February 2026. Rates are subject to change due to fuel costs and regional disparities.
When capacity tightens, less trailers become available as carriers reject tenders due to being at capacity. When capacity loosens, more trailers are available as carriers accept tenders with the market reflecting spot rates for each mode.
Fuel costs in the U.S. are determined by crude oil prices, refining costs, distribution and marketing, and taxes. The U.S. Energy Information Administration (EIA) Gasoline and Diesel Fuel Update includes the current fuel rate and how it’s changed week over week and year over year.
The spot market is heavily influenced by fuel rates as carriers often use the rate-per-mile method to calculate spot rates. The rate-per-mile method is a formula to calculate the total costs of a shipment based on its distance and fuel costs per mile.
Spot rates may be higher than contract rates because of the volatility of fuel rates and other market conditions, but they are generally preferred over contracts by small shippers when rates are low and freight needs to move quickly.
Spot loads are best for time-critical freight or shipments that don’t move frequently enough to need contract rates. While freight data analysis tools like DAT Trendlines and FreightWaves SONAR display this data for shippers to choose between spot rates and contract rates, keep in mind that spot rates vary per region and carrier.
Key indicators are a quantifiable metric used to monitor the spot market. This will provide you with real-time visibility into supply and demand, which allows you to make educated shipping decisions.
Rate direction shows whether spot freight prices are rising or falling. It reflects changes in demand, capacity, and carrier pricing behavior. High freight rates reflect a carrier’s market, which means more bargaining power for transportation providers. Lower freight rates are more favorable for shippers and lead to increased competition between shippers.
Rising rates signal tightening capacity and higher demand, while falling rates indicate excess capacity and lower shipment volume. Shippers use this trend to decide when to book loads or delay shipments.
While every spot rate has a base price, other accessorial charges may be added based on additional services a shipment might require.
Tender acceptance is the acknowledgement and commitment by a carrier to transport a shipment on behalf of a shipper. They do so at the agreed upon terms, rates, and conditions. Tender rejection is when a carrier denies a shipment request.
Tender rejection rates signal capacity tightness. When rejection rates increase, carriers prioritize higher-paying loads, which drives spot rates upward. High tender acceptance indicates supply chain efficiency and healthy carrier-shipper relationships.
Annual peak shipping seasons reflect spikes in customer demand and truck supply across industries. We’ve made a chart to illustrate the four primary peak shipping seasons in the United States.
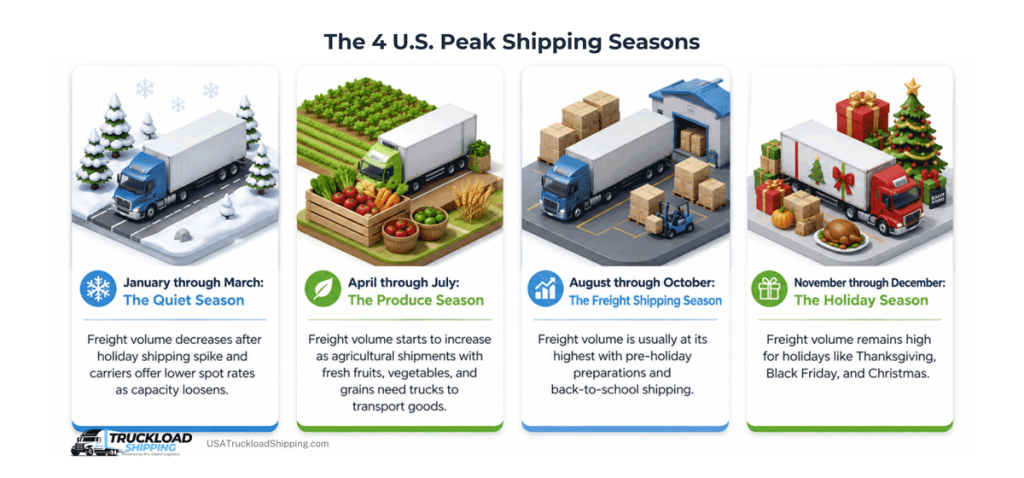
As you can see, spot market freight is moving continuously, but these seasons help shippers identify when freight volume matches carrier capacity and preferable spot rates.
Shippers use DAT RateView, SONAR, or consult with licensed freight brokers to review these key indicators to secure the best spot rates for their freight.
According to a 2025 DAT Market Update report, there are 5 freight market signals to watch each week:
Let’s break down this checklist into actionable steps that capture the best spot rates and support your supply chain.
If your team lacks time to monitor spot freight market indicators weekly, a 3PL can centralize data, reduce rate volatility risk, and secure capacity faster.
Do you need a reliable transportation provider for a last minute shipment? Call our team at (866)-353-7178 or navigate to our freight services page to find the one that’s right for you.
Sources:
Trendlines, DAT Freight and Analytics
SONAR Freight Market Updates, FreightWaves
Gasoline and Diesel Fuel Update, U.S. EIA
The 5 weekly signals every freight leader should watch, DAT, 2025
 Copy URL to Clipboard
Did you find this article helpful?
See more of our coverage on Google.
Add usatruckloadshipping.com as a preferred source!

R+L Global Logistics
315 NE 14th St., Ocala, FL 34470
